Core Services
Specialized analytics and reporting services for modern businesses
Data Engineering & ETL
Build reliable pipelines to move and transform data
- ETL pipeline development
- Data cleaning & transformation
- API integrations
+3 more features
Big Data & Cloud Analytics
Design scalable big data pipelines and cloud analytics platforms
- Apache Spark & PySpark development
- Data Lakes (AWS S3 / Azure ADLS)
- Batch & streaming pipelines
+3 more features
BI Dashboards
Interactive dashboards using Power BI and Tableau for real-time decision making
- Power BI & Tableau dashboards
- Executive KPI dashboards
- Real-time data refresh
+3 more features
Reporting Automation
Automated business reporting using JasperReports, SQL and Excel
- JasperReports development
- Automated report scheduling
- Pixel-perfect PDF reports
+3 more features
SQL & Database Optimization
Improve slow queries and design efficient data models
- Query performance tuning
- Stored procedures & functions
- Database design & modeling
+3 more features
HR & Workforce Analytics
HR dashboards, payroll reporting and workforce analytics solutions
- HR dashboards & KPIs
- Payroll & compensation reporting
- Attrition & retention analytics
+3 more features
Web Design & Frontend Development
Modern, responsive websites and marketing creatives for businesses
- Website design & development
- Responsive UI/UX design
- Landing pages & business websites
+3 more features
Industries We Serve
Retail & E-commerce
Financial Services
Healthcare
Manufacturing
Technology
Hospitality
Transportation
Education
Dashboard Examples
Dashboards and reporting solutions we build for clients
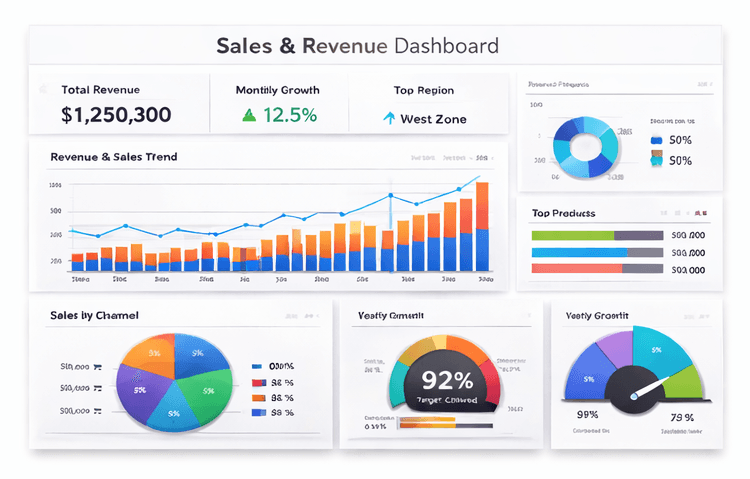
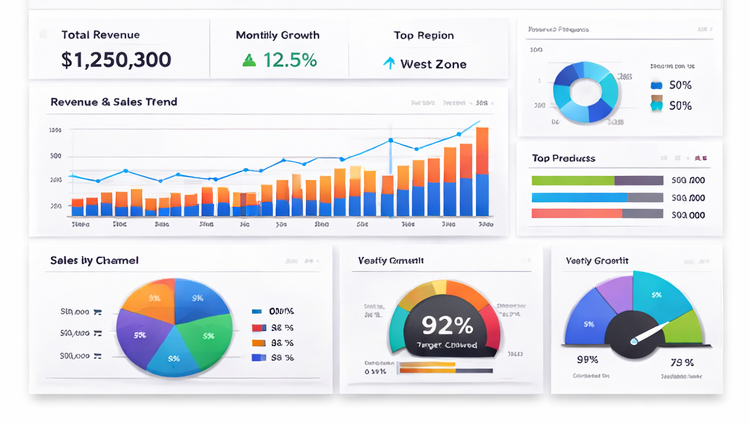
Sales & Revenue Dashboard
Business IntelligenceInteractive Power BI dashboard tracking revenue, regional performance, and growth trends.
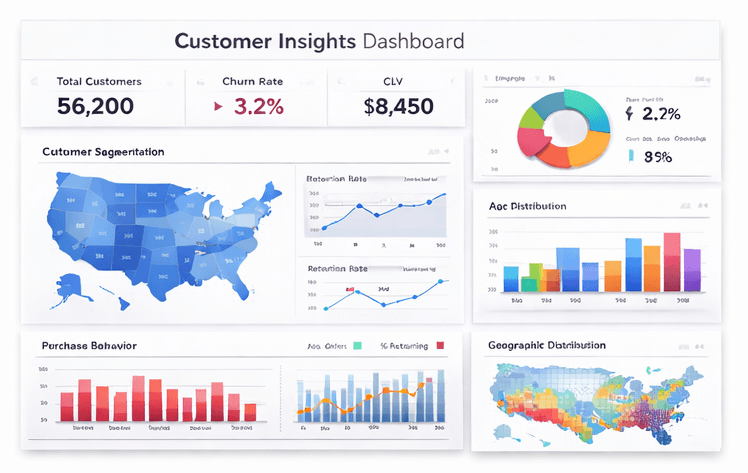
Customer Insights Dashboard
AnalyticsCustomer segmentation, retention metrics, and behavior analysis dashboard.
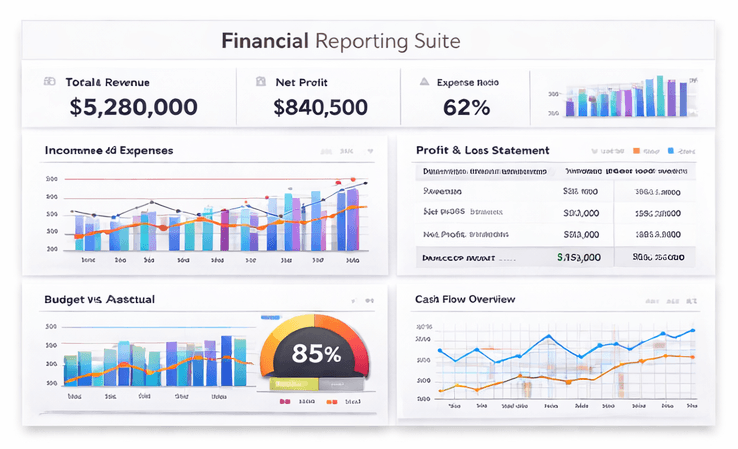
Financial Reporting Suite
ReportingAutomated financial and MIS reporting using JasperReports and scheduled delivery.
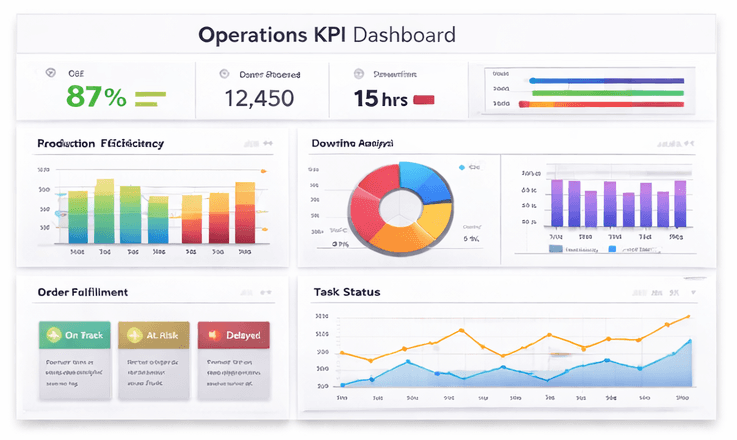
Operations KPI Dashboard
OperationsMonitor business performance, KPIs and operational efficiency in real time.
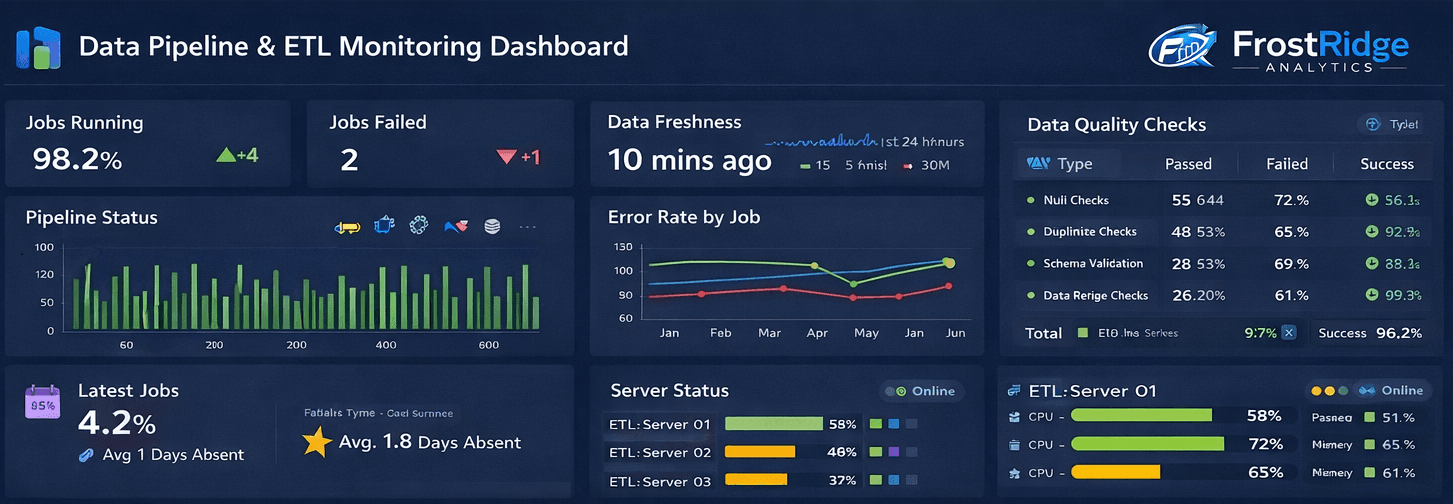
Data Pipeline & ETL Monitoring
Data EngineeringReal-time monitoring dashboard for ETL pipelines, data quality checks and system performance.
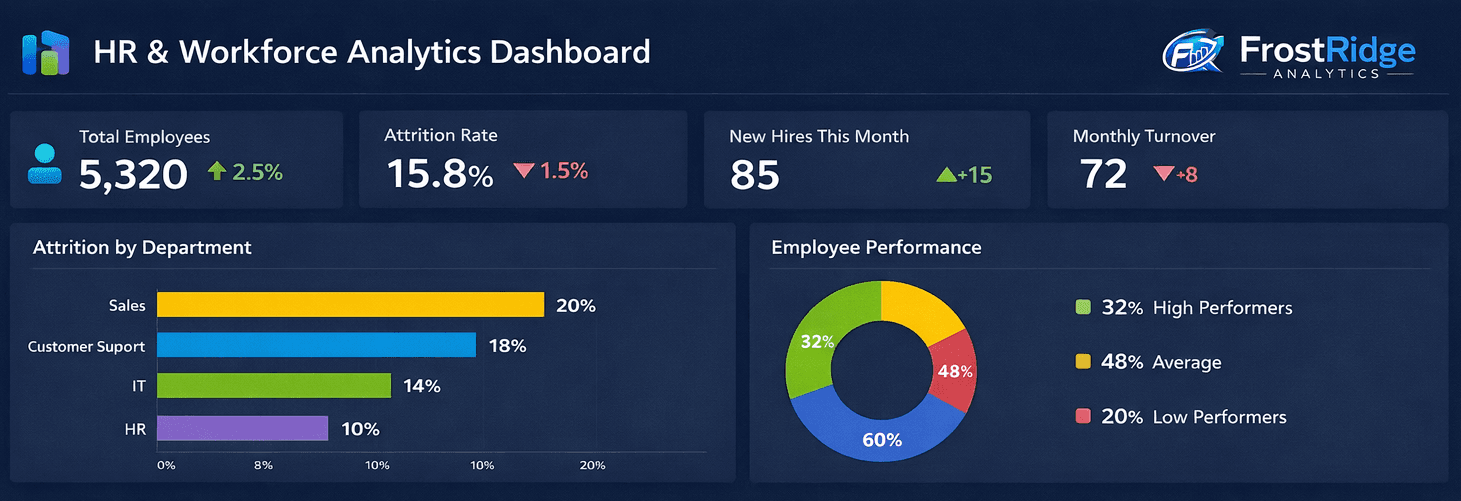
HR & Workforce Analytics Dashboard
HR AnalyticsTrack employee performance, attrition trends and workforce planning insights.